Oil Viscosity Chart: Calculated vs. Measured
 testDSC.Admin
An oil viscosity chart estimates viscosity between two known points; it does not prove the curve describes your sample. ASTM D341 allows that interpolation for kinematic viscosity, but TestDSC’s measured scan checks real behavior. The distinction matters when your sample gels, behaves non-Newtonian, or leaves the measured temperature range.
Turn2Engineering’s calculator and Interlub’s chart produce useful two-point curves. Neither shows how closely a calculated curve matches a real sample across the operating range. Neither explains that TestDSC reports dynamic viscosity in cP unless density is supplied for conversion to cSt.
What does an oil viscosity chart calculate?
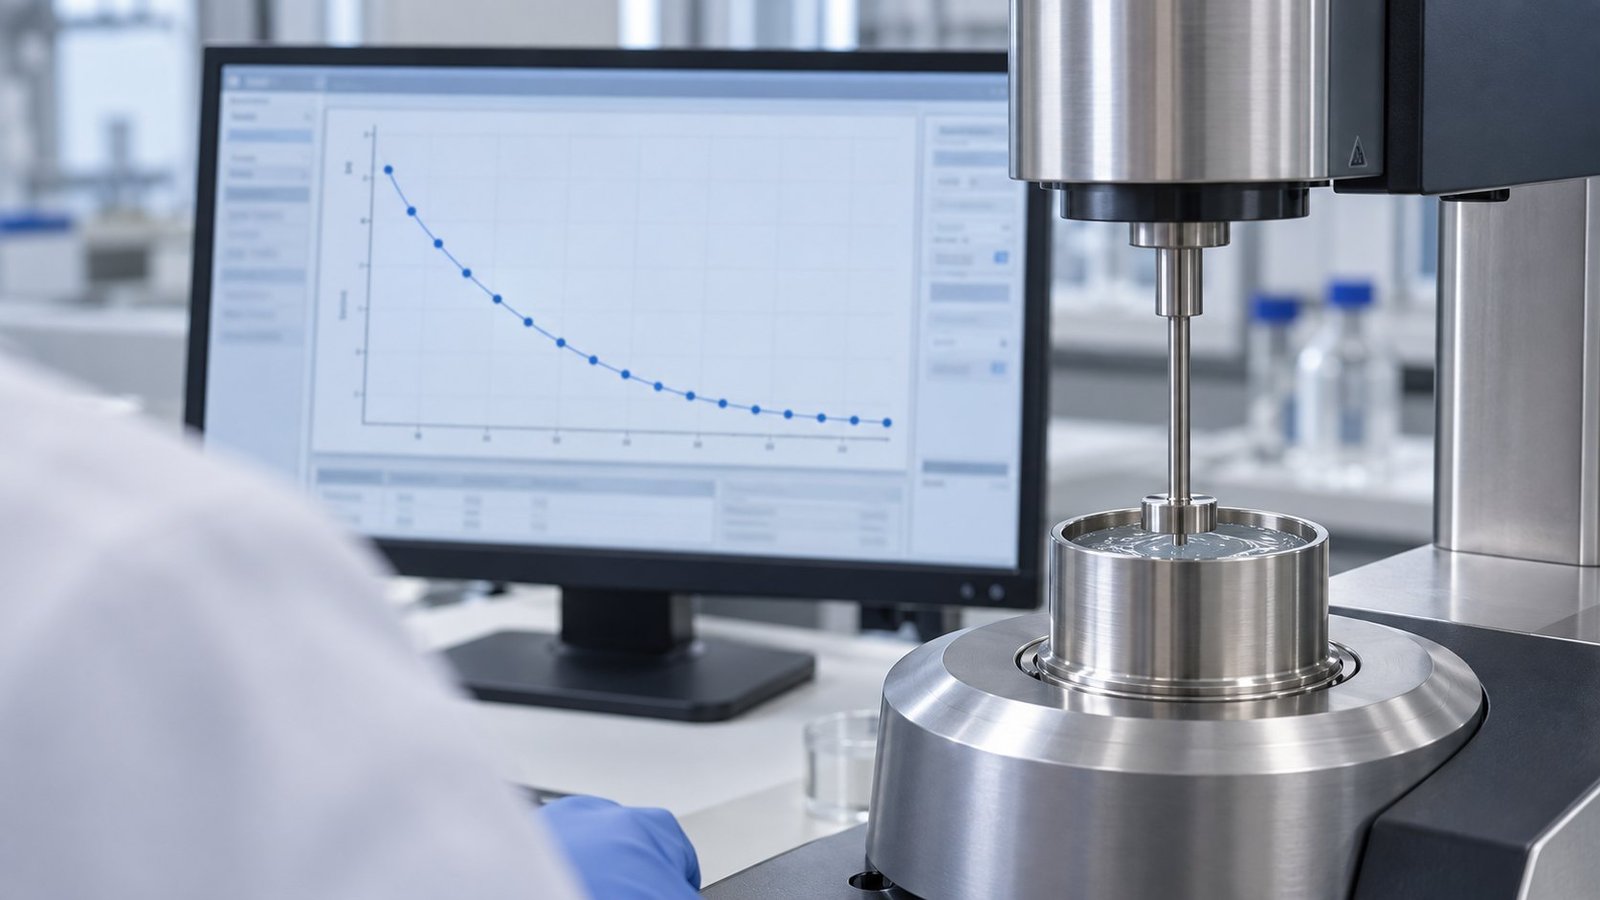
An oil viscosity chart calculates a kinematic viscosity-temperature curve from two known temperatures. Turn2Engineering’s Oil Viscosity Chart & Temperature Calculator uses 70.0 cSt at 40 °C and 10.0 cSt at 100 °C. Its worked result is approximately 22.3 cSt at 70 °C.
Interlub’s Oil Viscosity Chart also accepts 40 °C and 100 °C inputs. Both tools are useful for interpolation between supplied values. They do not establish that the calculated curve matches your actual formulation.
| Approach | Data supplied | Use when |
|---|---|---|
| Calculated curve | Two kinematic viscosity points | You need a quick estimate between known temperatures |
| Measured scan | Dynamic viscosity at multiple setpoints | You need sample-specific behavior across the operating range |
| Measured scan plus density | Dynamic viscosity and density at matching temperatures | You need calculated cSt values and residual analysis |
See also: Viscosity index explained: how oils hold viscosity across temperature
How does ASTM D341 estimate intermediate viscosity?
ASTM D341-20(2025), Sections 1.1 and 1.2, permits kinematic viscosity at an intermediate temperature to be estimated from two known temperature points. Section 5 supplies the equation framework used to calculate the curve.
For the Turn2Engineering example, 70.0 cSt at 40 °C and 10.0 cSt at 100 °C produce approximately 22.3 cSt at 70 °C. That result is an ASTM D341 viscosity estimate inside the supplied interval. It is not a measured result from the equipment or sample you are evaluating.
ASTM D341 describes a transformed relationship that improves the plotted straight-line behavior for petroleum oils and liquid hydrocarbons. The method does not replace a scan when the sample has phase changes, gelation, shear dependence, or another departure from the assumed curve.
Why does a calculated curve need a measured scan?
A measured scan tests whether the calculated viscosity temperature curve follows your sample at intermediate temperatures. TestDSC reports dynamic viscosity in cP. Density at the same temperature is required before those results can be converted to kinematic viscosity in cSt.
This distinction creates the validation gap in the ranking pages. A calculated oil viscosity chart can pass through two supplied endpoints while missing a sharp slope change, a low-temperature structure, or a non-Newtonian response between them.
If density is available at −20, 0, 20, and 40 °C, you can calculate cSt at each point and compare measured values with the chart. A residual can be expressed as measured cSt minus calculated cSt, or as a percentage of the calculated value.
What did the anonymized TestDSC run measure?
Run conditions
An anonymized TestDSC run used sample ID TS-AV-017 on an Anton Paar MCR 302e rheometer with a CC27 concentric-cylinder rotor. The temperature setpoints were recorded in 0.1 °C increments. The scan covered −30 °C to +40 °C and reported dynamic viscosity in cP.
| Temperature | Measured dynamic viscosity |
|---|---|
| −30.0 °C | 1,840 cP |
| −20.0 °C | 980 cP |
| −10.0 °C | 540 cP |
| 0.0 °C | 325 cP |
| 10.0 °C | 210 cP |
| 20.0 °C | 145 cP |
| 30.0 °C | 104 cP |
| 40.0 °C | 78.0 cP |
What the scan can and cannot prove
The measured oil viscosity decreases across the run, but the cP values cannot be plotted as ASTM D341 kinematic values without density. No density profile accompanied TS-AV-017, so calculated cSt values and chart residuals at −20, 0, 20, and 40 °C are not reported. Supplying one density measured at 20 °C would not validate every temperature point.
See also: Oil and lubricant viscosity testing from −30 °C to +40 °C
When should an oil viscosity chart stop being trusted?
Use a calculated curve for interpolation only when the sample remains within the measured range and follows the expected flow behavior. Stop relying on it when you extrapolate beyond the endpoints, observe gelation, or detect non-Newtonian behavior.
- Keep the estimate between the known temperatures. Failure trigger: extrapolating beyond −30 °C to +40 °C or beyond the 40 °C and 100 °C input pair.
- Collect measured points across the operating range. Failure trigger: a slope break or hysteresis that a two-point curve cannot represent.
- Obtain density at each comparison temperature before reporting cSt. Failure trigger: converting cP with a single unverified density value.
- Compare residuals with your project tolerance. For example, a residual above ±10% fails a ±10% acceptance limit. Failure trigger: systematic error at −20, 0, 20, or 40 °C.
- Check for gelation and non-Newtonian behavior. Failure trigger: a sharp viscosity increase, time dependence, or dependence on shear rate.
FAQ: Oil viscosity chart validation
Is ASTM D341 a measured viscosity test?
No. ASTM D341 supplies an equation and charting practice for estimating kinematic viscosity from two known points. A temperature scan measures the sample directly.
Can TestDSC cP results be used directly on an ASTM D341 chart?
No. TestDSC reports dynamic viscosity in cP unless density is supplied. Convert each temperature point to cSt using density measured at the same temperature before applying a kinematic viscosity chart.
When is a measured scan necessary?
A measured scan is necessary when your operating range extends across low temperatures, when the formulation may gel, or when a two-point estimate must be validated against actual sample behavior.
How can you validate an oil viscosity chart?
Use the ASTM D341 calculation as a screening estimate, then compare it with measured points from your sample. Provide matching density data when you need cSt values and residuals. For customer-supplied samples, specify the temperature range, setpoint increment, instrument configuration, and acceptance tolerance with the TestDSC viscosity testing service →
Send the sample ID, operating range, and required comparison temperatures through the TestDSC contact page →