What a DSC Double Melting Peak Really Means
 testDSC.Admin
A DSC double melting peak on a heating scan does not automatically mean your sample is contaminated or poorly mixed. In most polymer systems, two endotherms on one heating curve point to one of two well-documented thermal behaviors: crystals reorganizing as they heat, or two genuinely different crystal populations melting at different temperatures. Knowing which one you’re looking at changes what you report — and what you do next.
This post covers one question: why melting itself sometimes produces two peaks in a normal polymer sample, not furnace artifacts or purge-gas issues. We cover the two accepted causes, the scan-rate test that tells them apart, and how our analysts flag a double melting peak before calling it definitive.
What a DSC Double Melting Peak Actually Shows
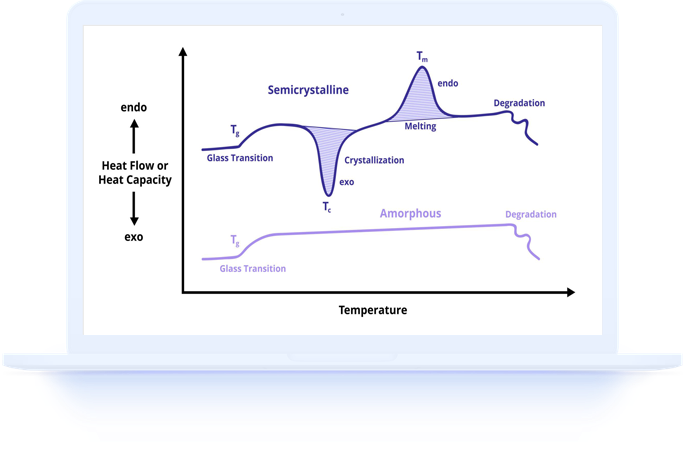
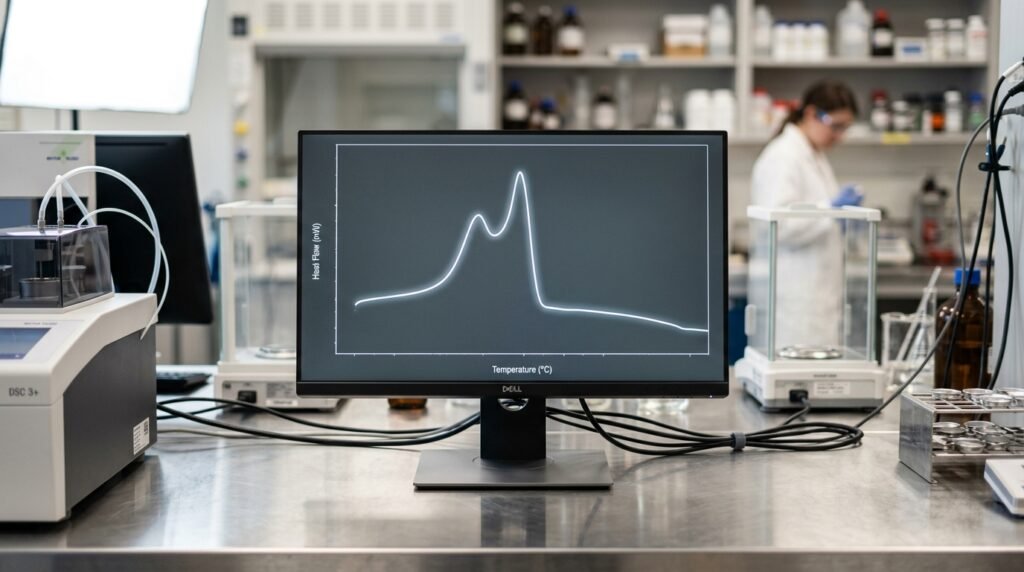
DSC curves plot heat flow, in mW, against temperature, in °C, as your sample heats at a fixed rate. A single, sharp melting endotherm is what you expect from a clean, uniform semi-crystalline polymer. When you see two peaks instead, the melting transition itself has split — you’re not looking at two unrelated events.
Reading a DSC thermogram with a double endotherm starts with three numbers: the temperature of each peak, the gap between them (ΔT, in °C), and how the total melting enthalpy (J/g) splits across the two. A 3°C separation with most of the enthalpy in the higher peak reads differently than two peaks of roughly equal area 10°C apart. This question comes up often enough that ResearchGate hosts a running discussion among polymer chemists asking the same thing: contamination, blend, or something else entirely.
See also: Exothermic and Endothermic Reactions in DSC: What the Peaks Tell You
Two Explanations Behind a Double Endotherm DSC Peak
In general polymer samples — not blends, not contaminated batches — a double melting peak comes from one of two mechanisms.
Melt-Recrystallization-Remelt (Reorganization on Heating)
The first cause happens inside the DSC cell during the scan itself. Thinner or less-perfect crystals melt first, at the lower temperature. If your heating rate is slow enough, the melted material has time to recrystallize into thicker, more stable crystals before the scan finishes — and those remelt at a higher temperature, producing the second peak.
This is well documented in nylon 6. The Wiley-published study by Todoki on drawn nylon 6 yarns traced the mechanism directly: original crystals melt out below 222°C, while the recrystallized population remelts around 228°C. The gap between the two peaks in that system runs roughly 6°C, and it narrows or disappears at faster heating rates, because reorganization needs time it no longer has.
Two Distinct Crystal Populations
The second cause is not a scan effect at all. Your sample can genuinely contain two populations of crystals that formed under different conditions and simply melt at different temperatures — primary crystals formed during an initial cooling step, and secondary crystals formed later, at a lower crystallization temperature or during a hold.
A ScienceDirect study using temperature-modulated DSC on poly(ether ether ketone), PEEK, traced this directly: the double melting peak tracked back to primary and secondary crystal populations formed at different stages of the material’s thermal history, not to reorganization during the heating scan. For PEEK and similar semi-crystalline engineering polymers, processing history — not scan conditions — is often the real driver.
See also: Purity Analysis by DSC: The Van’t Hoff Method Explained
How to Read a DSC Curve With Two Melting Peaks: The Rate Test
You do not have to guess which mechanism applies. The diagnostic is a scan-rate comparison, and it is the first thing we run when a double melting peak shows up in your data.
Run the same sample — or a matched aliquot — at two or three different heating rates, typically 2°C/min, 10°C/min, and 20°C/min, per ISO 11357. Watch what the lower-temperature peak does across runs:
- If the low peak shrinks and the high peak grows or shifts upward as the rate slows, you’re seeing melt-recrystallization-remelt — slower scans give crystals more time to reorganize.
- If both peak positions and their separation stay essentially fixed across all three rates, you’re looking at two real crystal populations, not a scan effect.
- If the low peak disappears entirely above roughly 20°C/min, that confirms reorganization — there simply isn’t time for it at the faster rate.
A second option is a quench-and-rescan protocol: melt the sample fully, quench it at 50°C/min or faster to erase its thermal history, then rescan immediately. If the double peak vanishes after the quench and only returns after a slow re-cool, it’s tied to how the sample was crystallized — a real population, not an artifact of your heating rate.
How TestDSC Flags a Double Melting Peak in Your Report
When one of our analysts sees two endotherms on a heating scan, we note both peak temperatures, the ΔT separation, and the enthalpy split between them directly in your report. We don’t average them into a single melting point and move on.
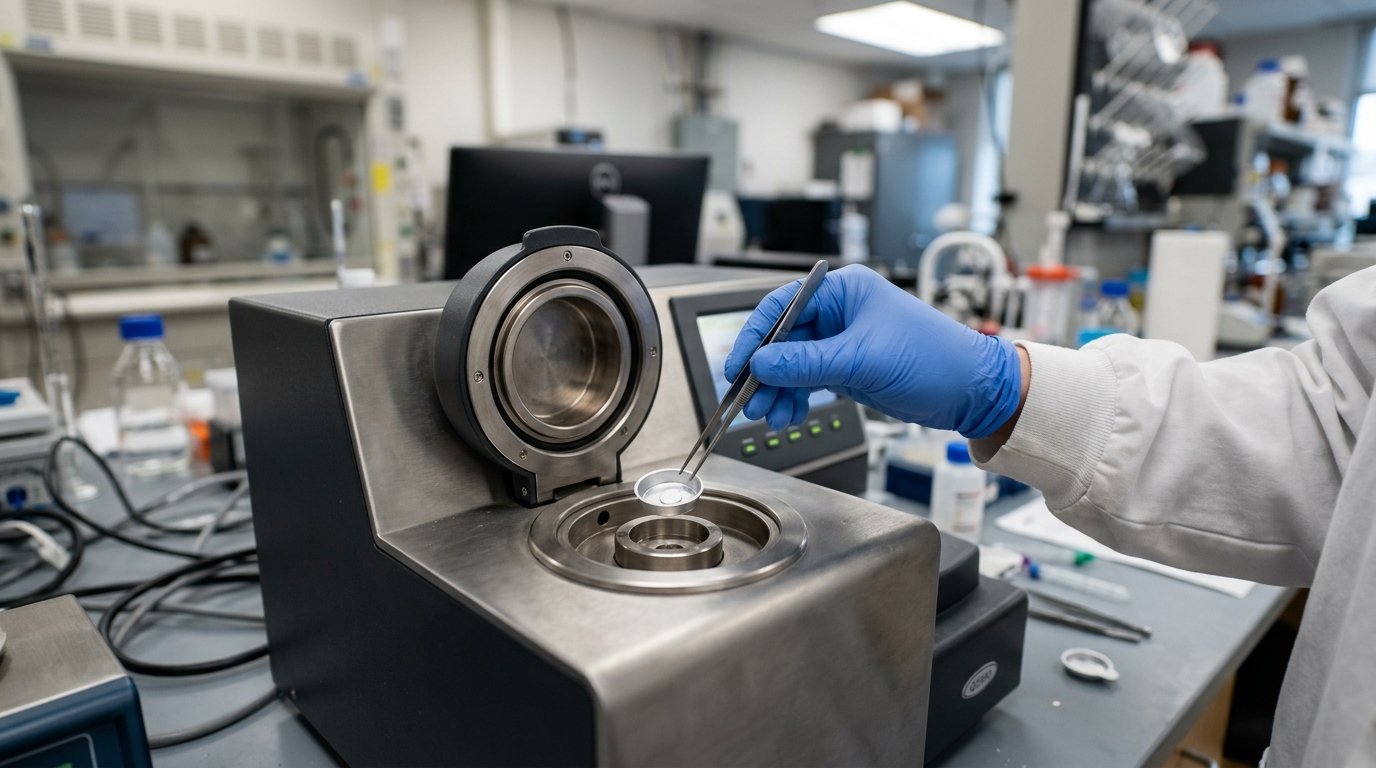
Before we call the finding definitive, our default is a follow-up scan on a fresh aliquot of your sample, typically 5-10 mg in a crimped aluminum pan. If your original run was at 10°C/min, we’ll usually suggest a repeat at 20°C/min and, where the instrument schedule allows, a slower 2°C/min pass across the same -30°C to +150°C window, or wider if your polymer needs it. For samples where processing history is the more likely explanation, we’ll suggest a quench-and-immediate-rescan cycle instead.
You get both curves side by side, with our read on which mechanism your data supports and why. If you want that follow-up scan built into your original order, tell us on the sample submission form or reach out via Contact Us before you ship material. →

FAQ: DSC Double Melting Peaks
Still working through your thermogram? Browse more answers on our Frequently Asked Questions page, or read the ones we hear most often about double melting peaks below.
Does a DSC double melting peak always mean my sample is contaminated?
No. In most cases it reflects normal crystal behavior — either reorganization during heating or two crystal populations from processing history. Contamination is possible, but it’s rarely the first thing to check.
What heating rate should I use to test for peak reorganization?
Run at least two rates, ideally several times apart — for example 2°C/min and 20°C/min — under ISO 11357 conditions. If the lower peak changes size or position between runs, reorganization is occurring.
Can I tell which explanation applies from a single scan?
Not reliably. A single DSC thermogram tells you a double peak exists, not why. The rate comparison or a quench-and-rescan is what separates the two mechanisms.
Does this apply to any semi-crystalline polymer, or just nylon and PEEK?
The mechanisms are general. Nylon 6 and PEEK simply have the clearest published data behind them — most semi-crystalline polymers, including polypropylene and PET, can show the same double endotherm behavior.
Get Your DSC Double Melting Peak Read Correctly
A double melting peak is data, not a defect report on its own. Reading it correctly means comparing scans, not staring at one curve and guessing. TestDSC runs DSC thermal analysis and automated temperature-scanning viscometry as a service on customer-supplied samples, and a double-peak flag on your report always comes with our recommended follow-up scan, not just a note. Visit the TestDSC home page to see the full range of thermal and viscosity testing we run on customer samples before you submit your next one. →
What is the peak melting temperature in a DSC result?
The peak melting temperature is the temperature at the maximum heat-flow response of an endothermic melting event, reported in °C rather than as the transition onset. For a double endotherm, report both maxima separately, such as Tm1 = 221.8 °C and Tm2 = 228.1 °C, following the peak-temperature convention in ISO 11357-3.
Do not substitute onset temperature for peak temperature: onset estimates when melting begins, while the peak identifies where the melting rate is greatest. The distinction matters when comparing lots or calculating the 6.3 °C separation between two melting events.
What does HyperDSC show for a double melting peak?
HyperDSC helps test whether a lower-temperature peak depends on time available for crystal reorganization by repeating the measurement at a much faster heating rate, commonly 100 °C/min. A reduced or absent low-temperature peak at that rate supports melt-recrystallization-remelt rather than two fixed crystal populations.
Because fast scans can reduce thermal lag between events, compare the peak temperatures, ΔT, and integrated enthalpy in J/g with a conventional 10 °C/min run. A peak that remains separated by approximately the same °C interval in both scans is less consistent with a reorganization mechanism.