Viscosity at every 0.1 °C: how automated viscometry works
Viscosity at every 0.1 °C: how automated viscometry works
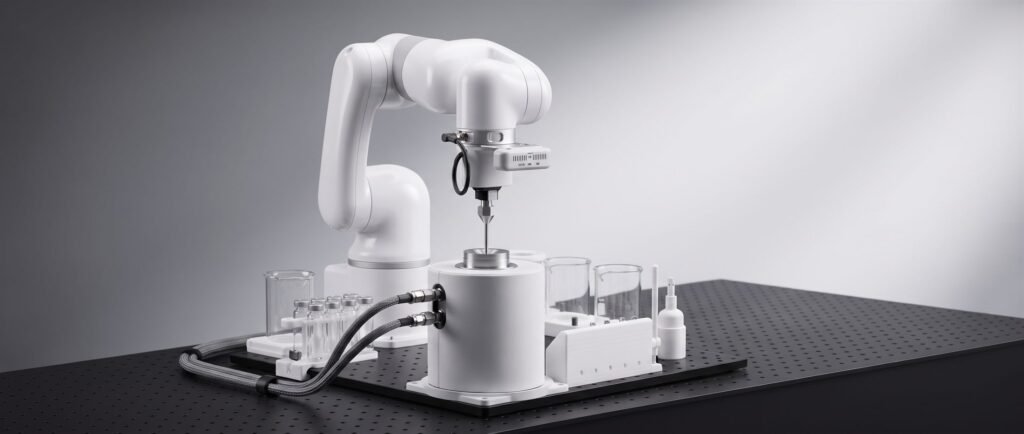
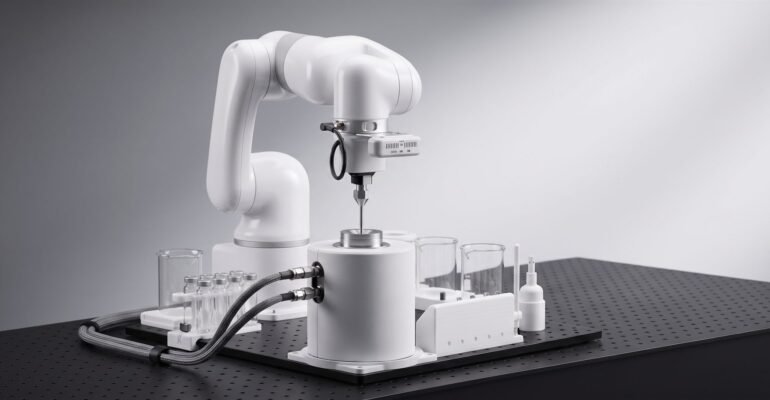
Traditional viscosity measurement is slow and manual: prepare a sample, set a temperature, wait, record, repeat. Automated viscometry changes the economics entirely. A six-axis robot stages the samples, fills the viscometer, sweeps temperature, and logs a viscosity reading every 0.1 °C — producing thousands of data points per sample without an operator at the bench.
Why density matters
Sparse measurements hide structure. Sampling every tenth of a degree resolves transitions, plateaus, and cold-flow behavior that coarse measurements miss — and the dense dataset feeds data-driven modeling of viscosity–temperature relationships.
The loop
Pick a vial, fill the cell, select the matching piston range, drive the circulating bath across −30 °C to +40 °C, and stream the curve to MATLAB. Then purge and move to the next sample. Repeat all night.