How to Measure Glass Transition Temperature (Tg) Using DSC
How to Measure Glass Transition Temperature (Tg) Using DSC
Glass Transition Temperature DSC Measurement Guide
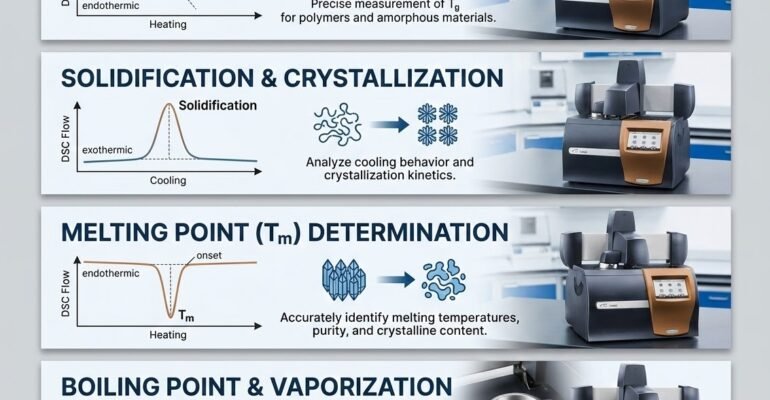
Glass transition temperature DSC analysis is essential for characterizing polymers and amorphous materials. Glass transition temperature (Tg) is one of the most important thermal properties, and Differential Scanning Calorimetry (DSC) is the most common technique used to determine Tg accurately.
Tg represents the temperature at which a material transitions from a rigid glassy state to a more flexible rubbery state.
Why Glass Transition Temperature DSC Testing is Important
The glass transition temperature determines many important material properties:
- mechanical stiffness
- molecular mobility
- thermal stability
- storage conditions for pharmaceuticals and biomaterials
Understanding Tg helps researchers optimize polymer performance, drug stability, and cryopreservation processes.
How DSC Detects Tg
During DSC analysis, Tg appears as a change in heat capacity rather than a sharp peak. This produces a step change in the DSC heat flow curve.
By analyzing the heat flow signal, researchers can determine the onset, midpoint, and endpoint of the glass transition temperature.
Materials Commonly Tested for Tg
Glass transition temperature measurement is commonly performed for:
- polymers
- cryoprotectant solutions
- biomaterials
- pharmaceutical compounds
- resins and adhesives
Glass Transition Temperature DSC Testing Procedure
The standard procedure for measuring glass transition temperature using DSC involves several key steps. First, the sample is prepared by weighing a small amount (typically 5-15 mg) and placing it in an aluminum or hermetic DSC pan. The sample is then loaded into the DSC instrument alongside an empty reference pan.
The test begins with a controlled heating program, usually at a rate of 10°C per minute. During heating, the DSC instrument continuously monitors the heat flow difference between the sample and reference. At the glass transition temperature, there is a characteristic step change in the baseline heat flow, indicating the material is transitioning from a glassy to a rubbery state.
For accurate results, a two-heating cycle method is often recommended. The first heating cycle eliminates thermal history effects, while the second cycle provides the true glass transition temperature of the material. The midpoint method (per ASTM E1356) is the most common way to report the Tg value from the DSC curve.
Factors Affecting Glass Transition Temperature Results
Several factors can influence the glass transition temperature measured by DSC. The heating rate directly affects the apparent Tg value – faster heating rates typically shift the transition to higher temperatures. Sample mass, pan type, and moisture content also play significant roles in measurement accuracy.
Molecular weight, plasticizer content, and polymer blending all affect the intrinsic glass transition temperature of the material itself. Cross-linked polymers generally show higher Tg values, while the addition of plasticizers lowers the transition temperature. Understanding these factors is crucial for interpreting DSC results correctly.
At TestDSC, our experienced team uses optimized DSC testing protocols to ensure accurate and reproducible glass transition temperature measurements. We provide detailed reports with clear Tg determination according to industry standards for polymers, pharmaceuticals, and advanced materials.