Exothermic and Endothermic Reactions in DSC: What the Peaks Tell You
Exothermic and Endothermic Reactions in DSC: What the Peaks Tell You
Exothermic and Endothermic Reactions in DSC: What the Peaks Tell You
Endothermic vs Exothermic: The Basics
All thermal events detected by DSC fall into two fundamental categories: endothermic processes that absorb heat from the surroundings, and exothermic processes that release heat. Understanding this distinction is essential for correctly interpreting any DSC curve.
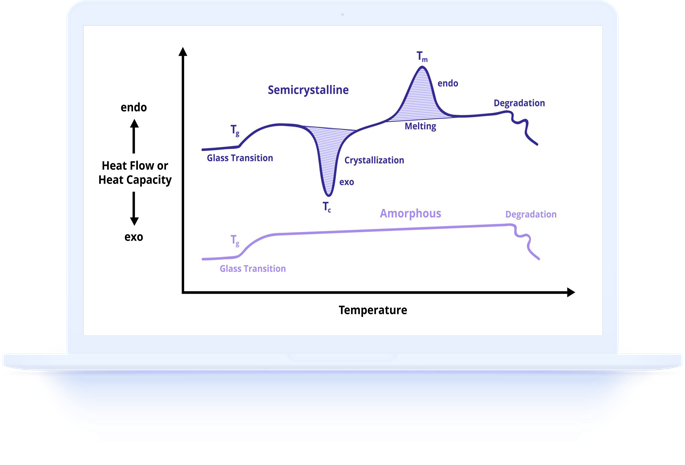
Endothermic events require energy input to proceed. They include melting, evaporation, dehydration, denaturation, and certain decomposition processes. On a DSC curve, endothermic events appear as peaks in one direction (the convention varies by instrument manufacturer, so always check the axis labels).
Exothermic events release energy as they proceed. They include crystallization, curing, oxidation, and certain phase transformations. On a DSC curve, exothermic events appear as peaks in the opposite direction from endothermic peaks. The magnitude of the peak reflects the amount of energy involved in the process.
Common Endothermic Events in DSC
Endothermic peaks are among the most commonly observed features in DSC curves. Melting produces the most prominent endothermic peaks for crystalline and semi-crystalline materials, with the peak area directly proportional to the amount of crystalline material present.
Beyond melting, other endothermic events include evaporation of water or solvents (broad peaks typically below 150 degrees Celsius), dehydration of hydrated crystals (sharp peaks at the temperature where water is released from the crystal lattice), and certain solid-state transformations where the product phase has higher energy than the starting phase.
Melting, Evaporation, and Denaturation
Melting is the most analytically useful endothermic event, providing both temperature and enthalpy data. Pure crystalline substances show sharp melting peaks at characteristic temperatures that serve as material identification markers. Polymer melting produces broader peaks reflecting the distribution of crystal sizes and perfection levels in the material.
Protein denaturation in food and pharmaceutical applications produces endothermic peaks as the ordered protein structure unfolds. The denaturation temperature relates to protein stability, while the peak area reflects the extent of native structure in the sample.
Evaporation of moisture appears as a broad, shallow endothermic feature typically between 50 and 130 degrees Celsius. While often considered an unwanted artifact, the evaporation endotherm provides useful information about moisture content and how tightly water is bound within the material matrix.
Common Exothermic Events in DSC
Exothermic peaks indicate processes where the product state has lower energy than the starting state. Crystallization from the melt is the most common exothermic event in DSC, producing a peak during cooling scans that reflects the rate and extent of crystal formation.
Chemical reactions such as polymerization, cross-linking (curing), and oxidation are exothermic processes frequently studied by DSC. The cure exotherm of a thermoset resin provides information about reaction onset temperature, peak reaction rate, and total reaction enthalpy.
Decomposition reactions may be either exothermic or endothermic depending on the material and atmosphere. Oxidative decomposition under air or oxygen is typically exothermic, while purely thermal decomposition under inert gas may be endothermic.
Crystallization, Curing, and Oxidation
Crystallization exotherms during cooling scans show the temperature and rate at which a molten material solidifies into a crystalline structure. The onset temperature indicates the maximum supercooling the material experiences before nucleation begins, while the peak temperature reflects the crystallization rate maximum.
Cold crystallization, the exothermic crystallization of amorphous material during heating, appears between the glass transition and the melting peak. Its presence indicates that the sample was cooled too rapidly during processing for complete crystallization, and its area reflects the amount of amorphous material that crystallizes during the DSC measurement.
Curing exotherms of adhesives, coatings, and composite resins provide essential manufacturing data. The onset temperature indicates when cross-linking begins, the peak temperature shows the most rapid cure rate, and the total peak area represents the energy available from the complete cure reaction.
Reading and Interpreting DSC Peaks Correctly
Correct interpretation of DSC peaks requires systematic analysis of several characteristics: direction (endothermic or exothermic), temperature position, peak shape and width, reversibility (does the peak appear on reheating?), and relationship to other thermal events in the same scan.
Baseline selection significantly affects quantitative peak analysis. The baseline represents the hypothetical DSC curve that would exist if the thermal event did not occur. Choosing the correct baseline type (linear, sigmoidal, or tangential) for each peak ensures accurate enthalpy values.
Artifacts and instrumental effects can produce features that might be confused with real thermal events. Common artifacts include baseline curvature at the start of a scan due to instrument equilibration, small spikes from electrical noise, and apparent events caused by sample pan deformation. Experience and running blank pans helps distinguish artifacts from genuine sample transitions.
When to Seek Expert DSC Analysis
When DSC curves show unexpected or complex peak patterns, expert interpretation adds significant value to the raw data. Our analysts are experienced in distinguishing real thermal events from artifacts, identifying overlapping transitions, and relating peak characteristics to material properties and processing history.
Our DSC testing services include both data generation and detailed interpretation tailored to your specific questions and applications. Contact us to discuss your thermal analysis challenges.